You may also be interested in...
The Cross-Tabulation tool allows you to measure interaction between multiple questions of your survey.It let you uncover relationships among the questions that are otherwise unclear.
Goto: Login » Surveys » Analytics » Online Tools » Cross-Tabulation
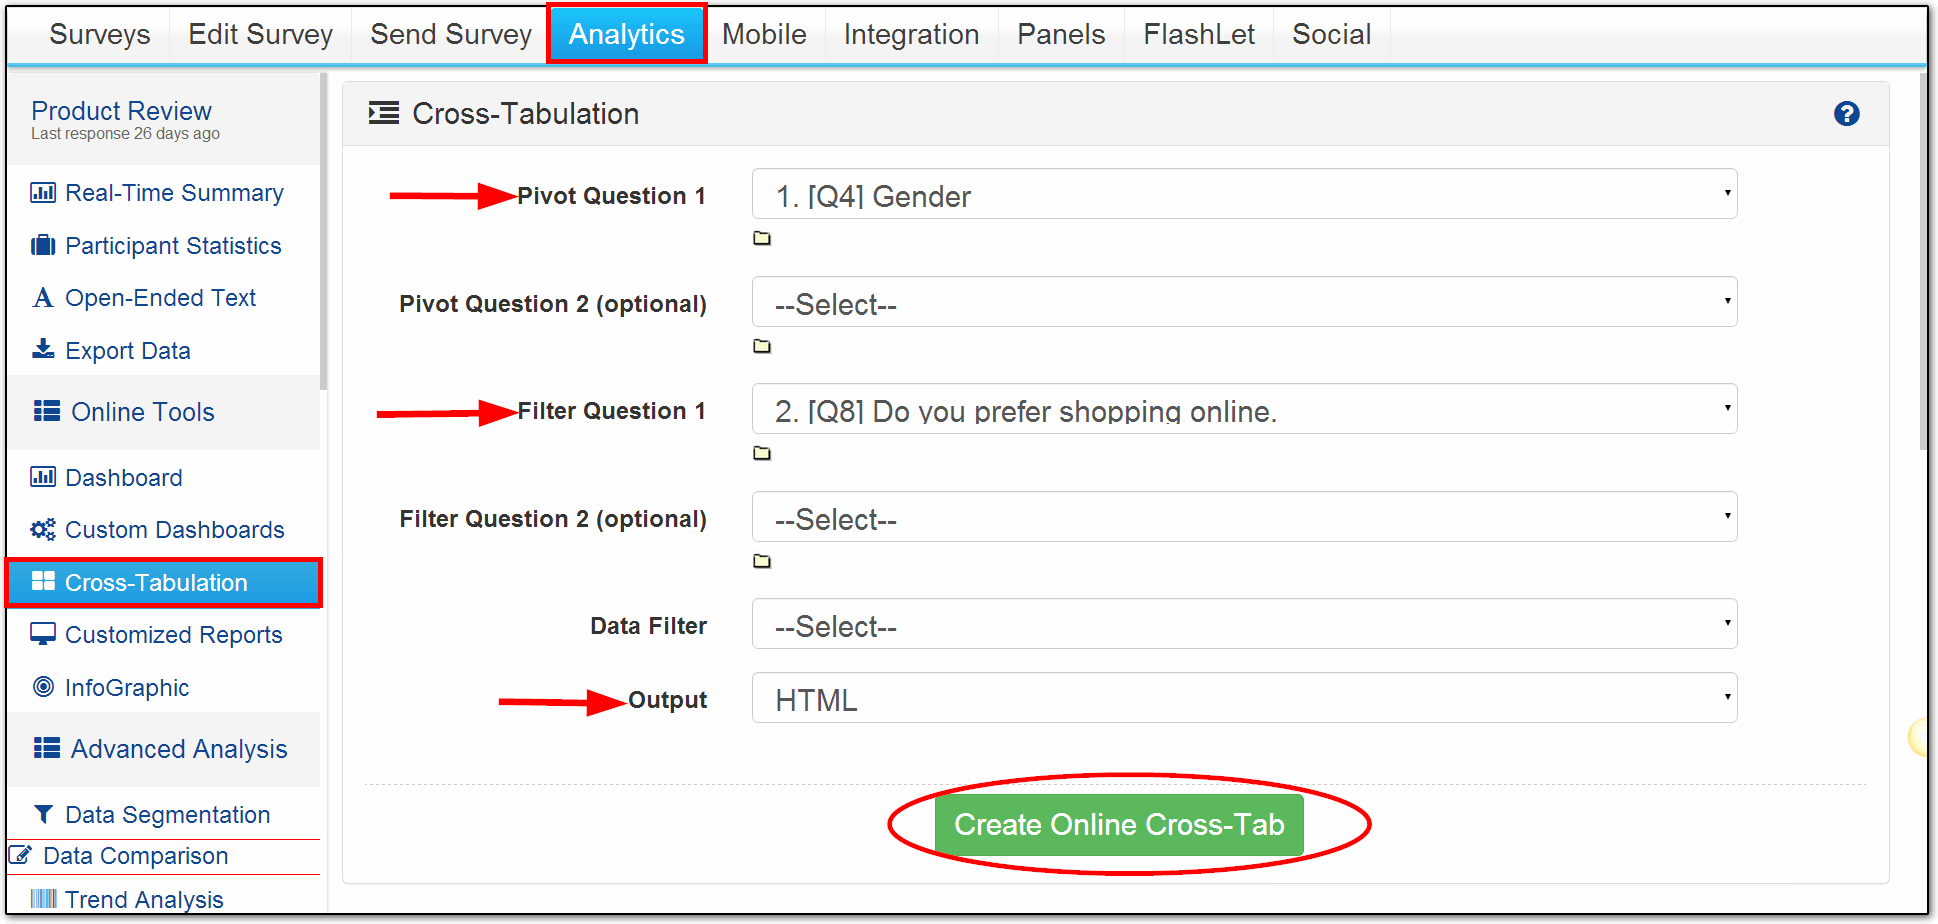
1. Select question from the Pivot Question 1 drop down, this question will be displayed as column question in the Cross-Tabulation.
2. Select the filter question from the Filter Question 1 drop down, this question will be displayed as row question in the Cross-Tabulation.
3. Set the value in the Output drop down, by default it is HTML and click on Create Online Cross-Tab.
1. Screenshot

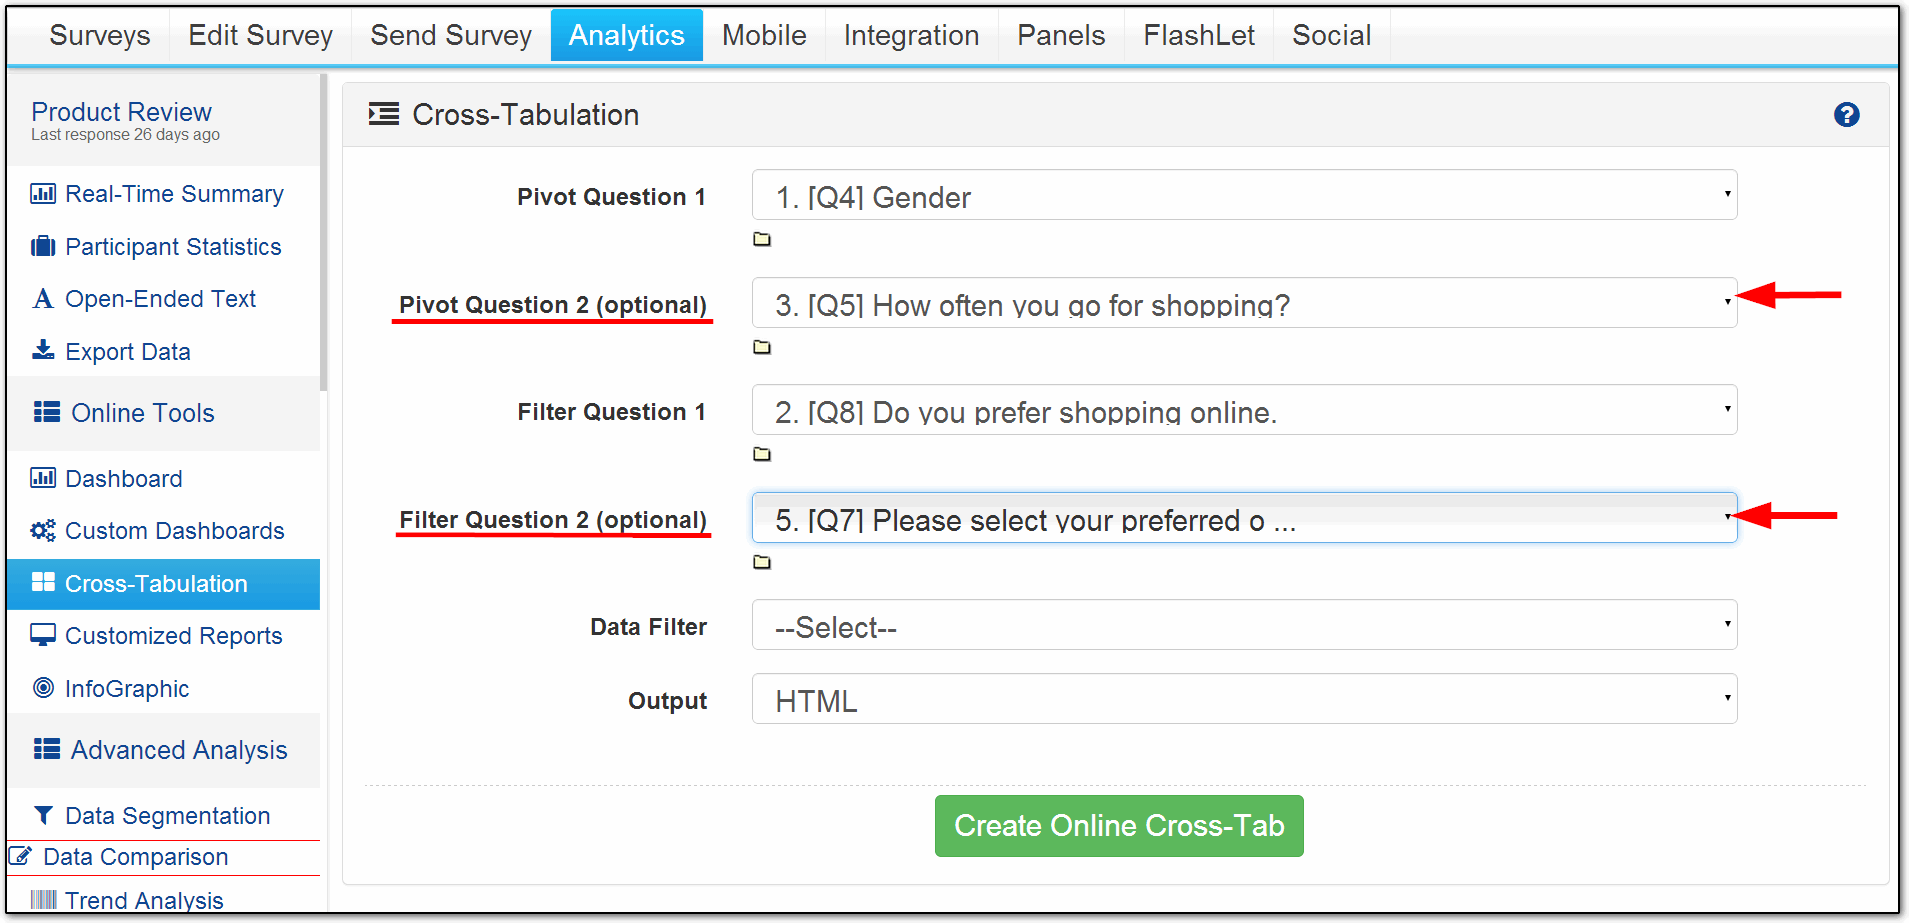
You can have at the most 2 questions on vertical axis (row) against 2 questions on horizontal axis (column).
To add more questions in the row/column of your cross tabulation, just set questions in the Pivot Question 2 and the Filter Question 2 drop down respectively.
2. Screenshot

All question types with Choice data (Muliple Choice, Single Choice, Matrix, Max-Diff etc.) are supported.
The Cross-Tabulation tool only takes into consideration all the respondents that have responded to both the questions -- In branched/multipage surveys there will be drop-outs.
Once you have set the questions to cross-tabulate, select the Excel option from the Output drop down.
1. Now set the value in the Display drop down, by default it is Data Table+Charts
2. Select the Chart Type from the drop down, by default it is Column chart if you bar charts instead of column you can changed it accordingly and now click Create Online Cross-Tab button.