The results
manager is a friendly and easy to use tool that allows you to analyze
the questions within the database.
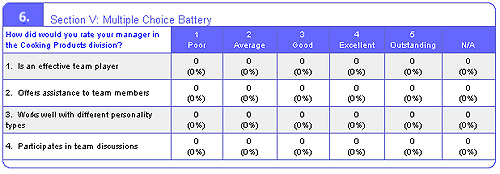
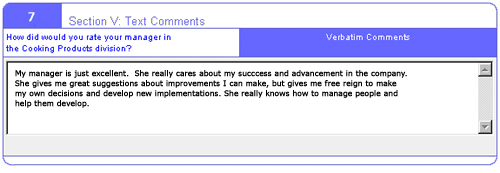
The results manager page is accessed from the "View Data Tabulations" tab and will appear as shown below. Within the results manager, survey
results can tabulated, cross tabulated, and charted. Below the top menu
bar are a set of links to other results manager options. From the EXCEL
Data Download option, the data may be saved and loaded directly into your
computer's EXCEL program. The Cross-tabulation tool computes cross-tabulation
tables. The Survey Statistics link reports the number of respondents who
have clicked on your survey and the number that have actually completed
the survey. The Comprehensive Survey Report and Summary Report are single
click options to generate the frequency tables, charts, and percentage
tables for your entire set of variables at one time. A further example
of these reports for a an actual data set may be viewed by Clicking Here.


Cross-tabulation is produced by specifying the row and column questions to be cross-tabulated. Click on the "Generate Crosstab" button and the table will be produced.


